
How to Build Your Own Business Dashboard Without Waiting for IT
Stop waiting for a data export or a developer. Here's a step-by-step guide to building your own live, shareable dashboard in minutes using Flitz's AI Gallery.
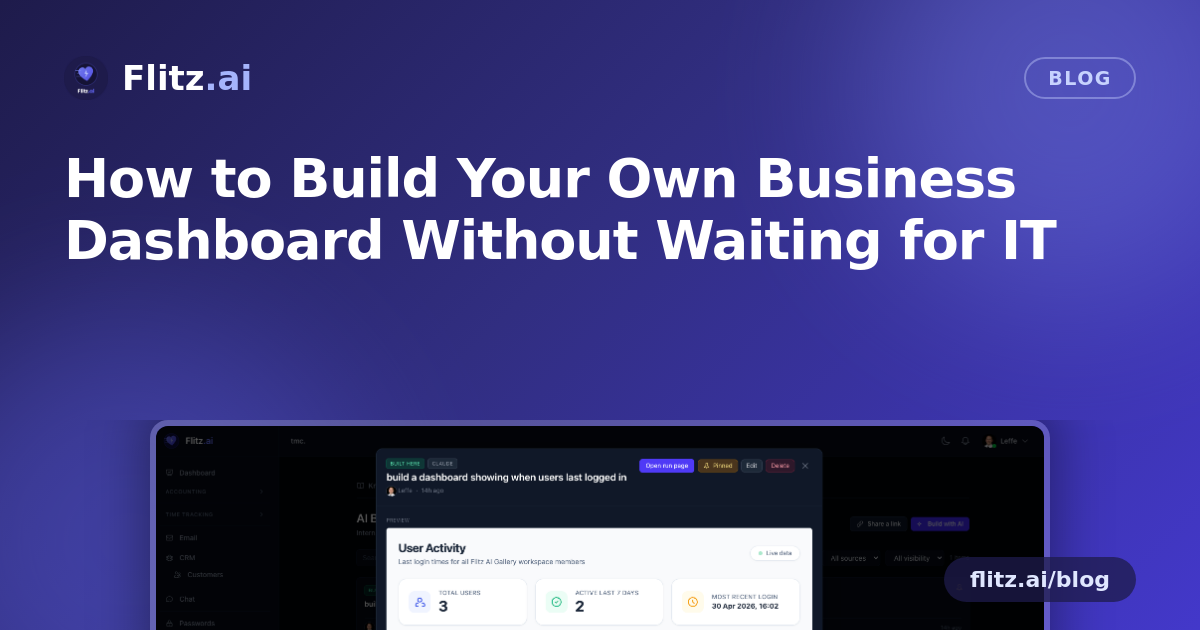
Every Swiss SME has the same quiet bottleneck: someone needs a simple internal tool — an absence calendar, a login tracker, an onboarding checklist — and the only options are to build it manually in Excel, nag the one colleague who "knows SQL," or open a ticket with an external developer and wait two weeks. By the time the tool arrives, the question has often changed.
The AI Gallery in Flitz removes that bottleneck entirely. Instead of describing what you need to someone else, you describe it to the AI, and it builds a working mini-app connected to your real business data — on the spot. Here's how to go from "I wish we had a dashboard for this" to actually having one, in five concrete steps.
Step 1: Identify the manual process you're tired of repeating
Most teams don't need a new dashboard every week — they need the three or four recurring ones nobody has gotten around to building. Common candidates for Swiss SMEs include:
- Tracking when team members last logged in, for security or activity reviews
- A client onboarding checklist showing status per stage
- An absence calendar for the upcoming quarter
- A simple overview of overdue invoices or open MWST items
If you currently build this by hand each month — copying data into a spreadsheet, formatting it, emailing it around — that's your starting point.
Step 2: Describe the tool in one plain-English sentence
Open the Gallery and type what you want, exactly as you'd explain it to a colleague: "Build a dashboard showing when each team member last logged in." No technical spec, no data schema, no ticket. The AI reads your sentence and starts building.
Step 3: Let the AI build it against your live data
This is the part that's genuinely different from tools like Lovable, Bolt, or Replit Agent. Those tools generate an app shell that you then have to wire up to a database yourself — API keys, authentication, CSV exports. In Flitz, the AI has direct, tenant-scoped SQL access through the same toolkit that powers the AI Assistant, with the same row-level security already applied. The artifact that appears in your browser — built with HTML, Alpine.js, and Tailwind — is already showing your real numbers, not sample data. There's nothing to export and nothing to connect.
Step 4: Refine it by chatting, not by re-briefing a developer
The first version is rarely the final version, and that's fine. Instead of filing a change request, just keep talking to it: "make the avatars bigger," "add a filter by role," "sort by last active." Each instruction triggers a rebuild of the artifact in seconds. This is also where the Gallery outperforms a traditional BI tool like Looker or Power BI — you don't need to be on the data team to make these changes, you just need to know what you want to see.
Step 5: Pin it, set visibility, and let it live permanently
Once you're happy with it, pin the dashboard to your team's gallery. From there you decide who sees it:
- Private — just for you, for ad-hoc analysis
- Shared with the team — visible to colleagues with author avatars attached
- Pinned to the main dashboard — a permanent fixture anyone can re-run
Unlike a one-off AI Assistant chat that disappears once the conversation ends, a Gallery item is persistent. It stays there, fully functional, for anyone on the team to open and re-run whenever they need it — no re-building, no re-asking.
What changes once your team adopts this
The underlying shift is who gets to build. Traditionally, dashboard requests flow upward — an employee has a question, it gets passed to whoever owns the data or the BI tool, and the answer comes back days later, if at all. With the AI Gallery, the person closest to the question — the office manager who needs the absence calendar, the account manager who needs the onboarding tracker — builds the answer themselves, in the time it takes to type a sentence.
There's also no new subscription to manage and no separate tool to secure. You're not paying for Lovable, Bolt, or Replit on top of your existing stack, and critically, your data never leaves your tenant during the process. The same access controls that protect your accounting, invoicing, and HR data in Flitz apply automatically to every dashboard built in the Gallery.
Getting started
If your team currently has a spreadsheet that gets manually rebuilt every month, that's the one to try first. Describe it in a sentence, watch the AI build it against your live data, iterate by chatting until it looks right, then pin it so nobody has to build it again. That's the whole process — and it's usually faster to do than it was to read this guide.